What Websites That Tripled Display Ad Revenue Have In Common

Get helpful updates in your inbox
What Websites That Tripled Display Ad Revenue Have In Common
Digital publishers are often reliant on display ad revenue for a gross amount of their total revenue. Recently, we took a look at 50 Ezoic publishers that used our platform for exactly 1 year (in our 2019 Publisher Performance Report) to see how they faired over the course of 2018.
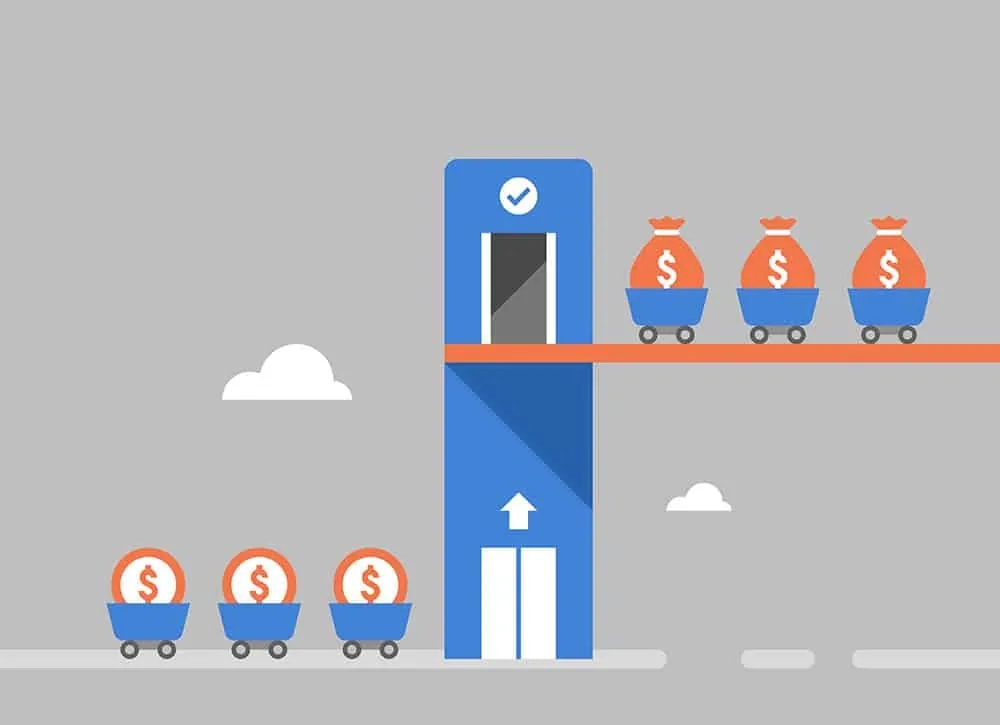
Inside that report, we found 20 digital publishers that tripled their display ad revenue in less than one year. The report only included publishers that used the Ezoic platform for a year and averaged more than $200 a month in display ad revenue.
We thought it would be interesting to dive deeper into this info to learn exactly what these websites had in common. What did these publishers do in 2018 to see such a dramatic improvement in total ad revenue?
Revenue and traffic are correlated …but not equal
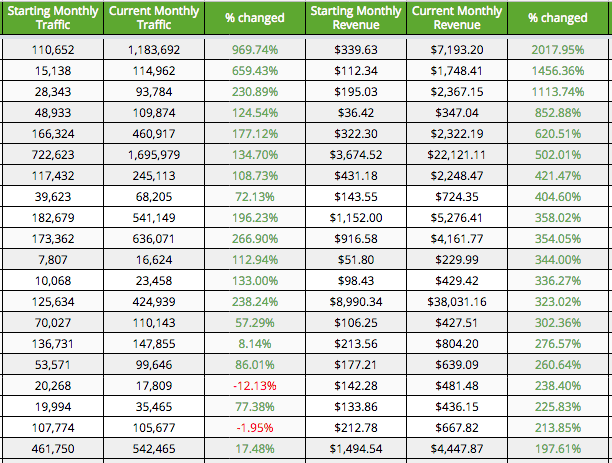
Of the 20 sites that saw their display ad revenue triple in exactly one year, 18 of them also saw their average monthly traffic increase as well.
When you hear that a publisher saw a 3x improvement in display ad revenue the next questions that should be asked is if the publisher also saw a 3x improvement in their website traffic. After all, if a publisher triples their web traffic it should be expected that they would also see a fairly equal uplift in their ad revenue.
In this case, 90% of the publishers that tripled display ad revenue also saw increases in their monthly traffic.
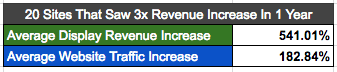
However, the average traffic increase was 182% while the average total monthly increase in display ad revenue was 541%.
In this case, these sites didn’t just increase their traffic. They actually did improve their display ad revenue far beyond the improvements they saw in their average traffic. In fact, the average improvements in revenue were more than double the average improvements they saw in traffic.
What’s more, these sites saw an average EPMV increase of approximately 223%. This means that the average display ad revenue that they earned PER VISITOR tripled among this group as well.
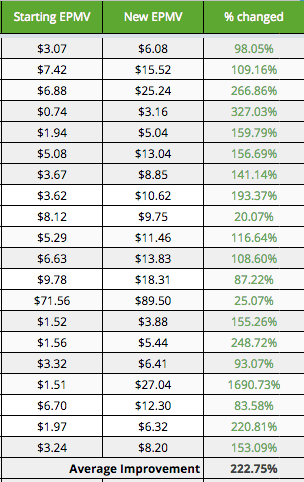
EPMV (earnings per thousand visitors) is the best way to objectively tell if a publisher is actually earning more revenue from the exact same amount of traffic than they were before. EPMV isn’t like RPMs or CPMs . It is not diluted by pageviews or the total amount of ads on the page. EPMV looks at the value of all the ads from an entire visitor session.
The takeaway is that EPMV is worth paying attention to. What these publishers did was actually increase their revenue per visitor along with their traffic in 2018.
What was the content like for these publishers?
It was surprising to see that the types of content that these 20 sites specialized in were fairly diverse. I could easily categorize the 20 sites that tripled revenue in less than one year into 6 different content verticals.
- Tool / Game – Sites that provided a free tool or game to visitors
- Evergreen Content – Sites that specialized in content that is referential or static (i.e. Who Was King George IV)
- News – Sites that specialized in publishing news or topical, real-time information
- Informational Websites – Sites that specialize in information on an evolving or specific topic (i.e. University scholarship info)
- Niche Content – Sites specializing in niche topics or subjects (i.e. self-help, recipes)
- Directory – Sites that provide a directory of data or information
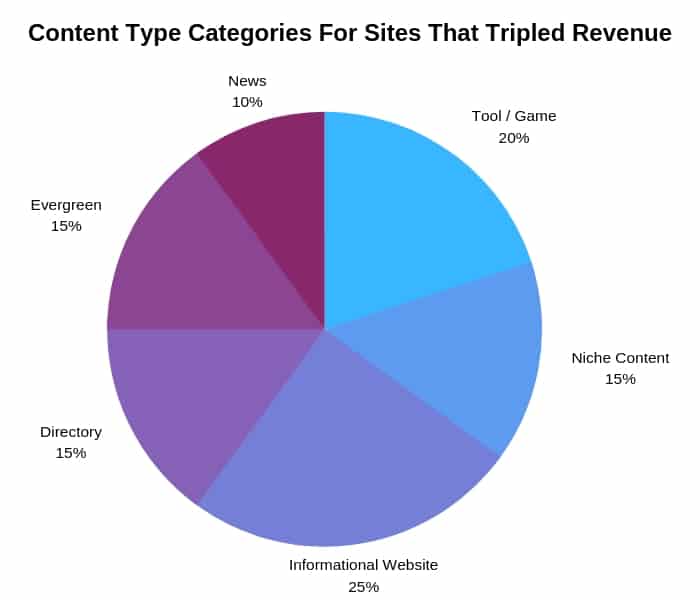
The good news for most publishers is that these categories are really quite different. The audiences for these different categories are polar opposites in many instances.
For example, the majority of the content on the Niche Content, Informational Websites, and Evergreen Content sites that we reviewed saw word counts between 1,000-2,500 words. Meanwhile, the News, Tool/Game, and Directory sites had average word counts between 500-750 words.
This just shows the vast differences between some of the content that these different types of publishers produced. However, inside their respective categories, the word counts were surprisingly similar.
For example, all 5 of the Informational Websites had the gross majority of their visits come to pages with more than 1,000 words or more.
The News, Tool/Game, and Directory sites showed the exact opposite. The gross majority of the visits to their sites came from articles or pages with less than 1,000 words on them.
Some of this information is fairly intuitive. Tool/Game sites are obviously not going to be as reliant on textual content to drive engagement from their audiences. You could say the same for Directory and News websites as well. Visitors come to get specific information and may not want a lot of added fluff.
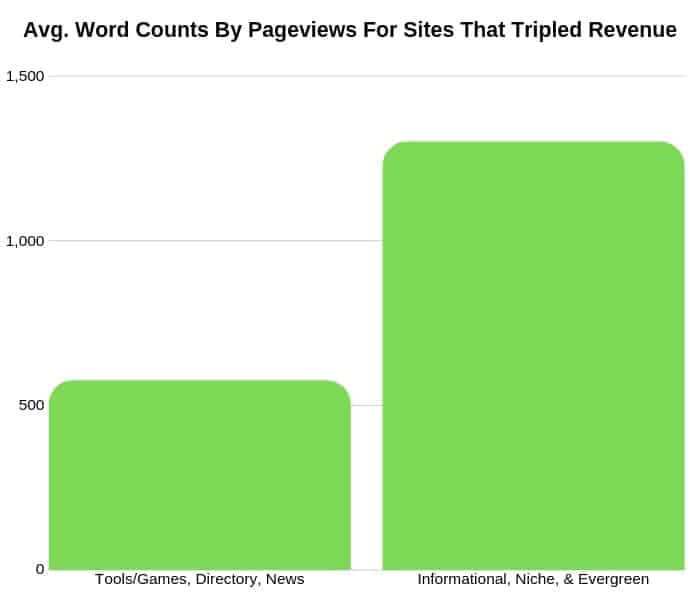
For Informational, Niche Content, and Evergreen sites, visitors are likely there to go there specifically for the textual content. This means longer form content is more likely to engage the visitor.
We’ve already touched on how visitor engagement and website revenue are correlated in past blogs so this may be helping us better understand what is driving the value on these sites to advertisers.
Did engagement increase along with revenue?
Since I just touched on the idea that these sites saw improvements in revenue because of increased website engagement, I decided that I should probably share what we found when we looked at avg. engaged time on site over the course of the year.
What is Engagement Time / Engaged Time On Site? Engagement time is the time recorded when website visitors are actively looking at a web page and interacting with it, but it excludes when users are quickly scrolling, waiting for a page to load, searching through navigation, or in other windows or tabs.
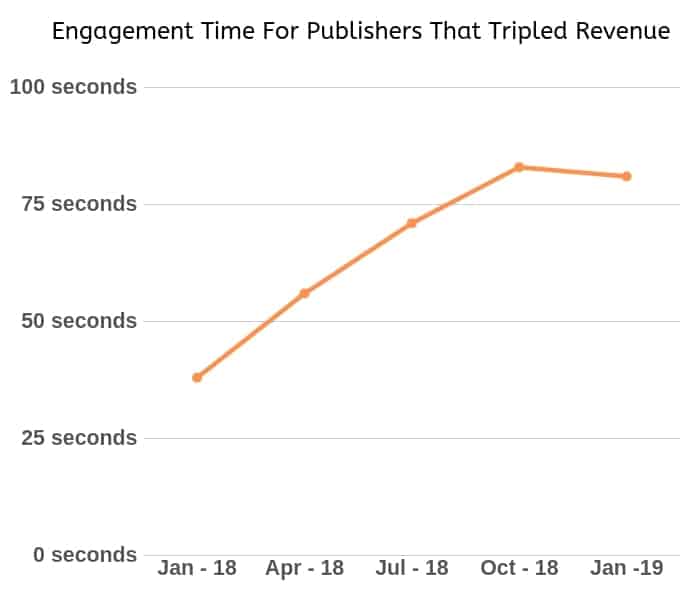
A major factor for the majority of the sites that tripled display revenue seems to be that they improved their engagement time over the time period that ad revenue grew. On average, these sites doubled their engagement time.
Some saw massive improvements. Others only saw modest gains of 12-15 seconds; however, all but one site saw improvements in engagement time.
How much content did these growing websites produce?
On average, the sites that tripled their display ad revenue produced 212 new pieces of content (articles, posts, or pages) in 2018. Each vertical had their own averages as well. News sites produced the most pieces of content and Evergreen Content sites produced the fewest.
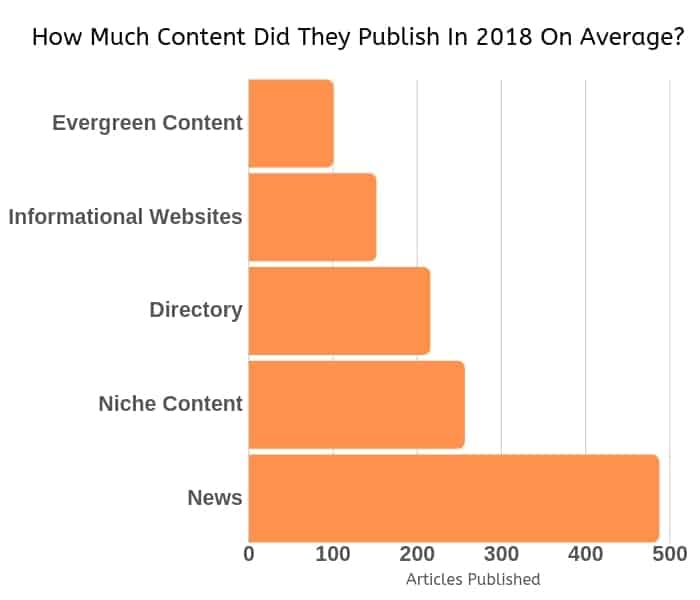
As you can see, all of these sites produced over 100 pieces of new content on average. The site that published fewest pieces of new content was an Informational Website that only produced 4 pieces of new content in 2018.
This was a big contributing factor in the traffic uplift that these publishers saw over the course of the year. As we discussed above, most of these publishers saw significant improvements in traffic during this time period.
Content creation was a contributing factor in the number of organic keywords these publishers gained in 2018 as well. Of the publishers that tripled display ad revenue, the average publisher gained 4,369 new ranked keywords in search engines.
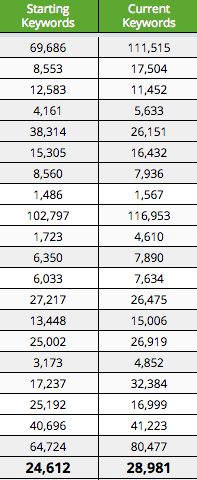
These keywords weren’t just for the new content produced. Many of the new keywords that these publishers gained were from existing content that started ranking in 2018.
What about traffic sources?
This is really one of the last pieces of the puzzle and should come as no surprise based on the data above.
The vast majority of these publishers have organic traffic as their primary traffic referral source. This means that the traffic that helped them drive the exponential increase in their display revenue came from visitors that landed on their site from search engines.
Let’s summarize what we know about publishers that tripled display revenue
There was a lot of data here to look at. In some cases, the data is there but there is no context. For example, traffic increased 200%… but revenue increased by 300%. What contributed to the improvement in revenue per visitor?
Here’s what we know about all of these sites:
- 90% increased website traffic
- 75% increased the number of keywords that they ranked for in search engines
- 95% increased visitor engagement time
- 100% increased EPMV (earnings per thousand visitors)
- 100% leveraged Ezoic’s Ad Tester
- 100% added new content
- 60% added over 100 pieces of new content
- 90% of them used more than 5 Ezoic apps
There are a few things to do based on this information.
- Focus on creating new content that engages visitors
- Measure website engagement time and discover which articles perform the best
- Understand which articles deliver the highest EPMV and create more content like that
- Go back and discover which articles rank poorly for good keywords and try to improve that content
- Leverage testing and personalization to increase engagement and increase display ad rates over time
Hopefully, these insights have helped you better understand how a diverse group of websites tripled their display ad earnings in 2018. Further questions or comments? Leave them in the space below and I’ll do my best to provide answers.
Tyler is an award-winning digital marketer, founder of Pubtelligence, CMO of Ezoic, SEO speaker, successful start-up founder, and well-known publishing industry personality.
Featured Content
Checkout this popular and trending content

Ranking In Universal Search Results: Video Is The Secret
See how Flickify can become the ultimate SEO hack for sites missing out on rankings because of a lack of video.
Announcement

Ezoic Edge: The Fastest Way To Load Pages. Period.
Ezoic announces an industry-first edge content delivery network for websites and creators; bringing the fastest pages on the web to Ezoic publishers.
Launch
Ezoic Unveils New Enterprise Program: Empowering Creators to Scale and Succeed
Ezoic recently announced a higher level designed for publishers that have reached that ultimate stage of growth. See what it means for Ezoic users.
Announcement
