User Engagement Impacts Ad Revenue (According To Data Science)

Get helpful updates in your inbox
How User Engagement Impacts Ad Revenue (Data Science)
What’s a good user experience and what’s a bad one? We could probably all agree that a good user experience is one in which user engagement is high. The visitor is reading the content, visiting multiple pages, and possibly sharing on his social media. What’s a bad one? The exact I opposite, right?

Defining these things in general terms is easy. Coming to terms with metrics that everyone agrees on is actually more complex than it might seem. Fortunately, there are some clear signals in the data that point us towards what types of things extend user sessions and generate more revenue.
Below, I’ll take you through a short run down of how data science can help us better define user engagement, and why it has such a dramatic and unprecedented effect on digital ad revenue. You’ll see what metrics matter most and how they are often impacted.
Watch A Data Scientist Talk About This instead of reading it Using This Video (Dr. greg StaRek)
A Data Driven Approach to User Engagement
We’ve touched on a few of these concepts before when discussing how publishers should approach monetizing long and short form content. However, as a quick refresher, it’s important to remember just how impactful extending the user session is the earning digital ad revenue.
…a user’s experience may do more to define the total revenue earned from a user session than just about any other factor at play in the publishing ecosystem

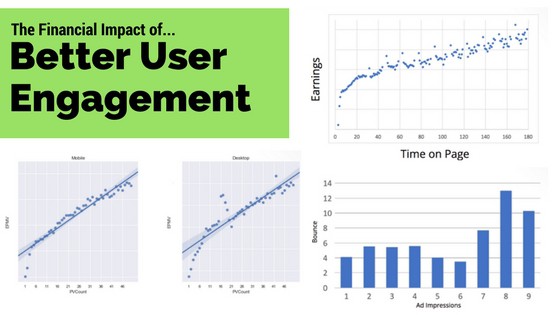
Extending the user session can best be measured by looking at two very simple user engagement metrics; pageviews per visit and session duration. In research by our data science team, we’ve seen a direct linear correlation between session length and revenue.

Pageviews per visit offer a very similar correlation with revenue. In fact, the impact of pageviews is actually slightly higher than that of session duration; however, both are very closely tied together.
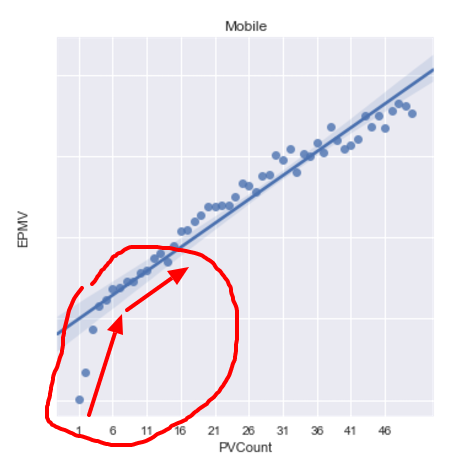
Additionally, as you can see here, especially on mobile, getting users beyond the first and second pageviews offers exponential revenue potential. This kind of user engagement offers a greater return than just about any optimization in ad demand could ever provide.
This leaves us with one clear conclusion about user engagement and digital ad revenue. These two things are inexorably tied. What’s more, a user’s experience may do more to define the total revenue earned from a user session than just about any other factor at play in the publishing ecosystem.
Bounce rate is the enemy of user experience
If pageviews per visit and session duration were Batman and Robin, then bounce rate is the Joker. A website bounce is an ultimate opt-out. It is arguably one of best user engagement metrics for benchmarking good user experiences and bad ones.
On a single landing page (read why you should look at landing pages vs. pages here), you can compare how bounce rate changes with different site alterations to ultimately determine which changes are good and bad for user experience (in a crude way).

So, what do we know about bounce rate and digital revenue? Quite a bit actually. It’s often thought that ads play a major role in the actual bounce rate from a page. This is kind of true, but maybe not in the way that many think.
At a recent Mediatel event on data science in the digital publishing space, it was claimed by one major media brand that all ads had some form of negative impact on bounce rate.
The data would actually disagree. In fact, below you can see that sometimes this is erroneously the opposite.

Ads do affect bounce rates, but they are different on every site. In fact, they are different on every page, for every user. Yikes. That’s a lot of caveats.
On the site displayed above, you can see that 6 impressions is sort of the user threshold before they start seeing exponential increases in ad revenue. This is different for every site, but in this case, if this site were to just go ahead and put 6 ads on every page they’d actually be shooting themselves in the foot and leaving a lot of money on the table.

You see, each page is different, some pages – like reference pages – may naturally have a higher bounce rate than others. This means tolerance from users may be much higher on these pages; therefore they might be able to handle 7 or 8 ad impressions on average. On other landing pages, 6 ads may be too many on average, and showing 6 could cost you valuable additional pageviews.
You can’t treat everyone the same and deliver excellent user experiences
Even if all the assumptions above are true, and you could set ad impression averages on a landing page by landing page basis, you still wouldn’t be properly adjusting for how each user personally reacts to each of these scenarios.
…what do we do with users that prefer a losing (A/B test) experience?
What our data science team found in studying this was that this is where A/B testing largely fails. The fundamental premise of A/B testing is based on majority rule, this means a winner and loser. In the case of user experiences, what do we do with users that prefer a losing experience (i.e. fewer ads, or more ads)?

As you can see above, traditional A/B testing of things like user engagement would say, 60% of users liked A best, so A wins. That means you implement an all A solution. But what about users that preferred B?
The optimal experience, in this case, would be one that optimizes ad impressions by landing page and user behavior. One that allowed for an A/B/C/D/etc. implementation.
This is why we’ve found so much importance in multivariate testing. How do all the variables affect bounce rate, session duration, and pageviews per visit. This is really where A.I. can benefit publishers in the future.
Applying data science to your site
If you’re not using Ezoic, the best thing you can do is to start looking closely at your landing pages, and how different site elements are affecting the simple user engagement metrics listed above. Changes that positively improve them will increase ad revenue, and those that don’t will decrease revenue.
This sounds like an oversimplification, and it is. Unfortunately, one universal truth our data science department has found when studying this over the past 6 years is that there are no real laws as it related to how user experience affects revenue. The only thing that is fixed is that extended user sessions result in higher ad revenue.
Optimizing your site to extend user sessions will almost always have you on a true north path towards better user experiences; plus who doesn’t just want to give you visitors better experience just because they deserve it?
This is obviously where we think A.I. can help the digital publishing space (as noted by the video at the top, and the one right above the last title). If this is a subject you’d like to learn more about, I’d recommend watching both of those; as they dive in a little deeper.
Questions, thoughts? Leave them below and I’ll keep the conversation going.
Tyler is an award-winning digital marketer, founder of Pubtelligence, CMO of Ezoic, SEO speaker, successful start-up founder, and well-known publishing industry personality.
Featured Content
Checkout this popular and trending content
Ranking In Universal Search Results: Video Is The Secret
See how Flickify can become the ultimate SEO hack for sites missing out on rankings because of a lack of video.
Announcement

Ezoic Edge: The Fastest Way To Load Pages. Period.
Ezoic announces an industry-first edge content delivery network for websites and creators; bringing the fastest pages on the web to Ezoic publishers.
Launch
Ezoic Unveils New Enterprise Program: Empowering Creators to Scale and Succeed
Ezoic recently announced a higher level designed for publishers that have reached that ultimate stage of growth. See what it means for Ezoic users.
Announcement
