Mobile Usage Statistics: Key Facts and Findings for Publishers

Get helpful updates in your inbox
Mobile Usage Statistics For Publishers
 Mobile devices have become an integral part of our daily lives. We use them at work, at home and everywhere in between to stay connected to the world around us. And while the desktop computer is far from dead, mobile-only Internet usage is on the rise — especially amongst the Millennial crowd. Take a look at some of the mobile usage stats and smartphone statistics below to see exactly where things are headed.
Wondering what other practices are growing and which are declining? We’ve put together a compilation of all mobile usage statistics from a variety of resources to help you get a better picture of the overall mobile landscape.

Over half of an average adult’s daily internet usage time is spent on mobile devices.
Each year, Kleiner Perkins Caufield & Byers (KPCB) publishes a comprehensive Internet Trends Report that highlights key Internet and mobile usage statistics as well as insights on how they relate to current economic, social and political environments. Reports for past years can be found on the KPCB website.
We already know that this is the culprit of ad earning fluctuations for many publishers. In fact, it is one of the first areas they should check if ad earnings decrease (HERE’S HOW).
As recounted in the 2015 Internet Trends Report, the average adult spent 5.6 hours a day on the Internet in 2015. Of that total, 2.8 hours was spent on a mobile device. This is a significant increase from 2010, when an average of just 0.4 hours a day was spent on the Internet via mobile device or smartphone.

Looking at the chart, we can see that average daily Internet usage for the desktop/laptop and other categories stayed fairly flat from 2010 to 2015 but increased 600% on mobile devices. That is, total Internet usage time has increased by 75% since 2010, but almost all of that growth is due to mobile devices. (Note: The Other category includes OTT and game consoles.)
Additional findings in this report:
- Mobile ad spending is poised for growth. Although U.S. users reported spending 24% of their total media consumption time (total includes radio, television, mobile, Internet and print media) on mobile devices in 2014, only 8% of advertising spending was allocated to mobile ads.
- 87% of Millennial smartphone owners stated that their phone never leaves their side, day or night.
- 75% of video views on Facebook are on mobile devices.
Many publishers who had previously optimized — and believe that they properly tested their sites— are experiencing stagnant ad earning growth due to these changes and associated changes in user behavior. More than ever, publishers are benefiting from multivariate ad testing.
92% of U.S. adults own at least one cellphone or smartphone statistics say.
Despite being already saturated, the cellphone market continues to grow. The Pew Research Center’s 2015 Technology Device Ownership Survey found that 92% of U.S. adults own a cellphone (including smartphones) and 45% own a tablet computer. As shown in the chart below, this is an increase from 2010 – especially significant for tablet ownership. On the other hand, desktop and laptop computer ownership has dropped slightly since 2010.

When asked specifically about smartphone ownership, 68% of the total respondents said they did own a smartphone. Pew Research first asked this question in 2011 and, at that time, only 35% of U.S. adults had smartphones – that is, smartphone ownership has almost doubled in four years.
The 2015 percentage for smartphone ownership was much higher for certain demographic groups, such as for those in the 18-29 age group of which 86% reported having a smartphone. Additionally, 81% of respondents with a college degree or higher level of education owned a smartphone.
Tablet ownership was also more likely for those with a higher annual household income or level of education. 62% of college-degree holders and 67% of those with a household income of $75K or more reported owning a tablet.
In 2015, 68% of emails were opened on either a smartphone or tablet
Are your newsletters and other emails optimized for mobile viewing? If not, this is something you might want to add to your marketing to-do list sooner rather than later.
Movable Ink analyzed 6.03 billion emails in 2015 and summarized the findings in its U.S. Consumer Device Preference Report. The study found that over two-thirds of emails were opened on a mobile device with 52% being opened on a smartphone and 16% being opened on a tablet.

Other notable findings of this report:
- For emails from the Media, Entertainment and Publishing vertical, 48% were opened on a smartphone.
- 62% of Kindle Fire users and 48% of Android smartphone users spent 15 or more seconds reading emails opened on those devices, compared to 41% of desktop users.
- At 42%, the iPhone was the device most frequently used for email opens. Android smartphones accounted for 10% of email opens.
- Retail mobile opens spiked as high as 90% in the weeks leading up to Christmas.

From June 2013 to June 2015, mobile app usage time grew by 90%.
Although mobile browser usage continues to grow, apps are the preferred tool of choice on mobile devices and account for almost 87% of total mobile usage time. Looking more closely at the numbers, the 2015 U.S. Mobile App Report from comScore found that U.S. adults spent 778,954 minutes using mobile apps in June 2015, up from 409,847 minutes in June 2013 – an increase of 90%.

Mobile apps account for 54% of the total time spent consuming digital media, and mobile browsers account for another 8% of total time. All in all, 62% of digital media usage time is spent on a mobile device.
According to the same comScore report, the top mobile app for U.S. adults in June 2015 was Facebook with almost 126 million unique visitors. Google Search came in at #4 with over 81 million unique visitors. In fact, eight of the top nine apps for this time period were owned by either Facebook or Google. This is something publishers may want to consider more heavily if they are thinking about incorporating Facebook Instant Articles or Google’s AMP into their publishing strategy.
Top 10 Mobile Apps by Unique Visitors – June 2015
- YouTube
- Facebook Messenger
- Google Search
- Google Play
- Google Maps
- Pandora Radio
- Gmail
- Apple Music
In Q4 of 2015, Facebook had 823 million mobile-only monthly active users.
Now, since it’s such a powerhouse in the mobile world, let’s look at Facebook a little more closely. In its quarterly earnings report, Facebook reported the following global results for the fourth quarter of 2015:
- 1,591 million total monthly active users
- 1,442 million mobile monthly active users
- 823 million mobile-only monthly active users

From Q4 2013 to Q4 2015, Facebook’s mobile-only monthly active users grew 178% from 296 million to 823 million. At the end of 2015, mobile-only users accounted for almost 52% of all Facebook users globally.
As more and more users are shifting to the mobile Internet, smartphones, and tablets, a well-defined mobile strategy is a necessity for today’s publishers. How mobile-friendly is your website?
In addition to providing mobile-enabled layouts on the Ezoic platform, Ezoic also has an app creator that lets you easily build a mobile app for your website. To learn more, visit www.ezoic.com and get started today.
Tyler is an award-winning digital marketer, founder of Pubtelligence, CMO of Ezoic, SEO speaker, successful start-up founder, and well-known publishing industry personality.
Featured Content
Checkout this popular and trending content

Ranking In Universal Search Results: Video Is The Secret
See how Flickify can become the ultimate SEO hack for sites missing out on rankings because of a lack of video.
Announcement
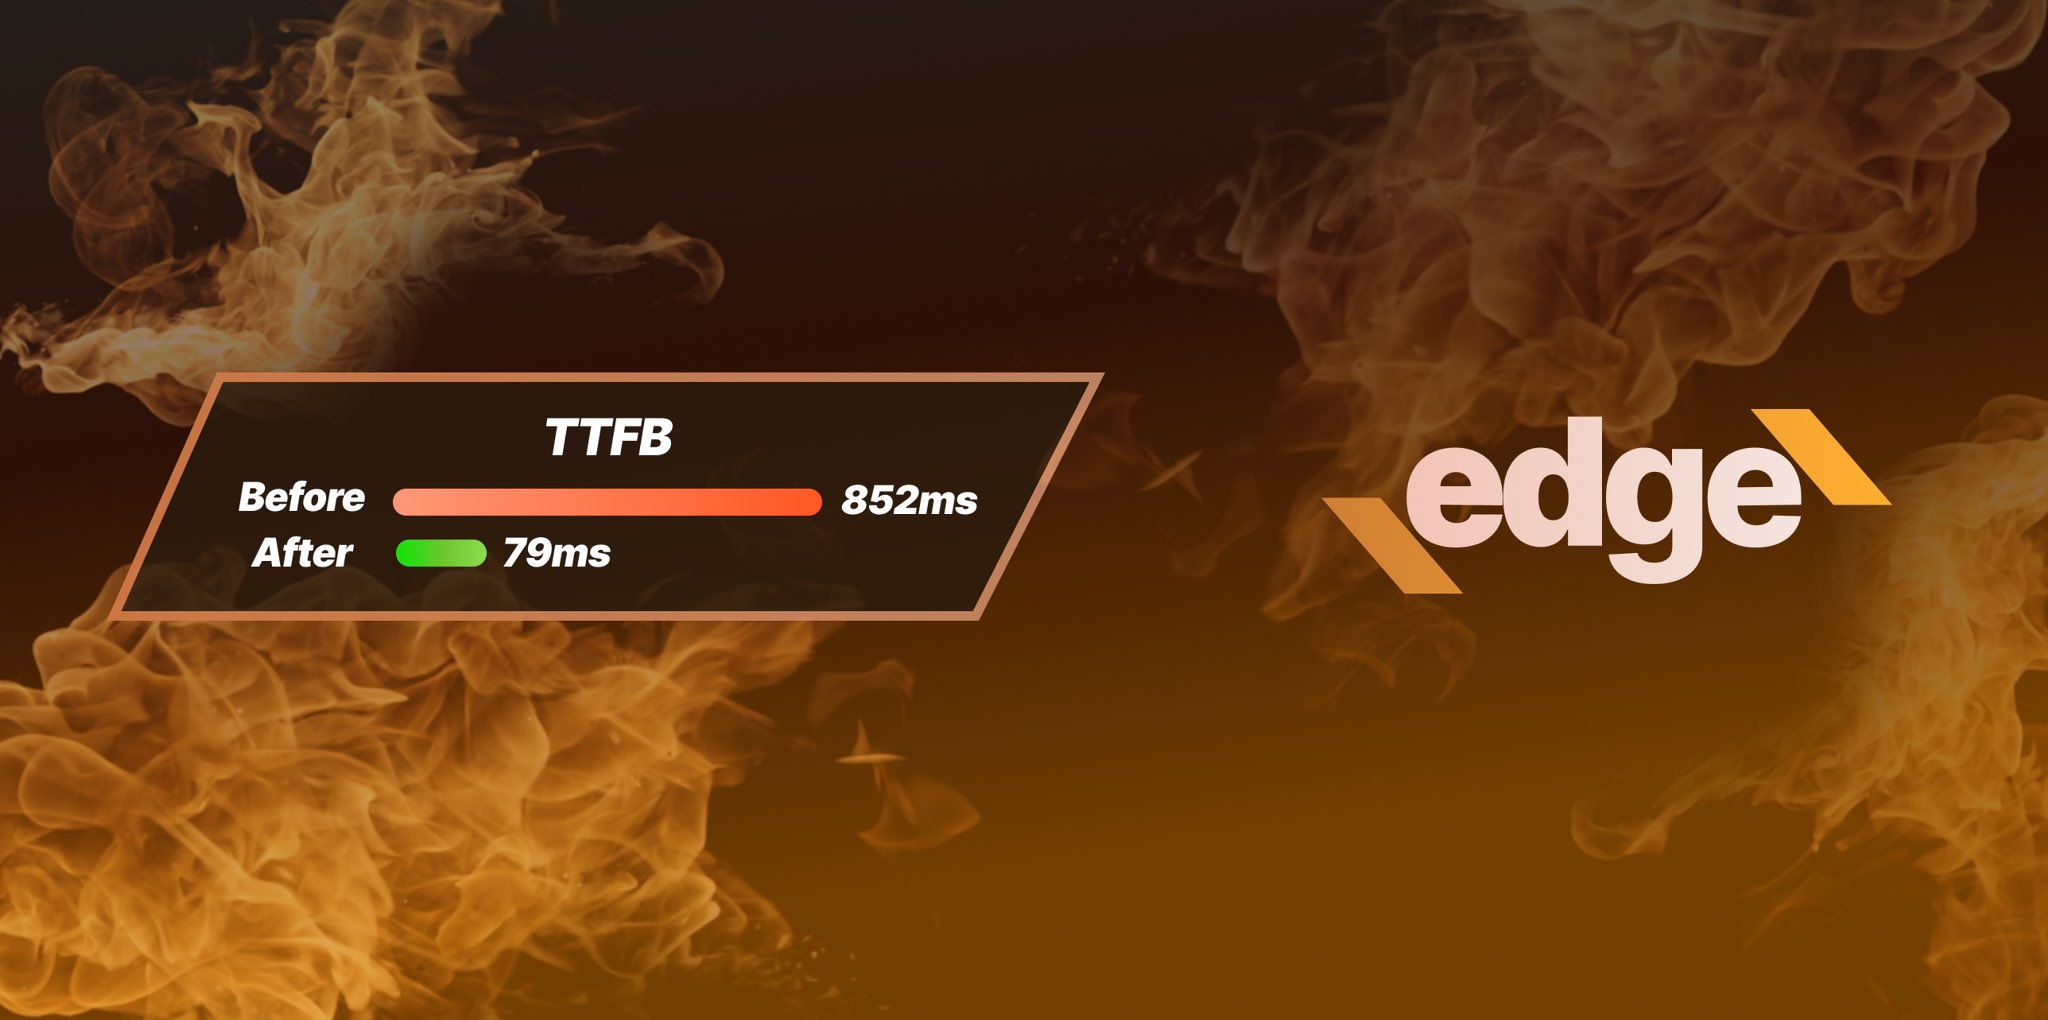
Ezoic Edge: The Fastest Way To Load Pages. Period.
Ezoic announces an industry-first edge content delivery network for websites and creators; bringing the fastest pages on the web to Ezoic publishers.
Launch
Ezoic Unveils New Enterprise Program: Empowering Creators to Scale and Succeed
Ezoic recently announced a higher level designed for publishers that have reached that ultimate stage of growth. See what it means for Ezoic users.
Announcement
